Manipur ethnic conflict characterised by brutality: Data
The Hindu
A database reveals that Manipur experienced daily conflicts for three months after ethnic violence erupted, displacing thousands and hindering relief efforts.
A database compiled using news reported in the local media shows that Manipur witnessed conflicts almost every day in the three months after ethnic violence broke out on May 3, 2023. Such incidents, which were initially limited to the Kuki-Zo community-dominated Churachandpur district in the hilly areas, later spread to the urban valley districts of Imphal East and Imphal West and the rural valley district of Bishnupur. Notably, such incidents in the Naga-dominated hill districts were relatively muted.
The violence, which continues sporadically even today, has displaced thousands of people including pregnant women and children. Local media reports also point out that hundreds of trucks which were carrying humanitarian aid were stranded or attacked in May, stalling relief for the victims.
The conclusions are based on data gathered by the Mapping Humanitarianism Initiative of the Centre for New Economics Studies, Jindal Global University. The group has used a mix of news reports in the local media and data provided by institutions working in the affected areas to map the violence. Also, data were collected from organisations which provided advocacy for entitlements under victim assistance schemes. An incidence of violence recorded by one source is verified by comparing the reportage with two or three other sources which reported on the same incident.
Chart 1 | The chart shows all the incidents of conflict and armed violence, both lethal and non-lethal, that occurred in Manipur following the eruption of ethnic violence on May 3, 2023.
Chart appears incomplete? Click to remove AMP mode
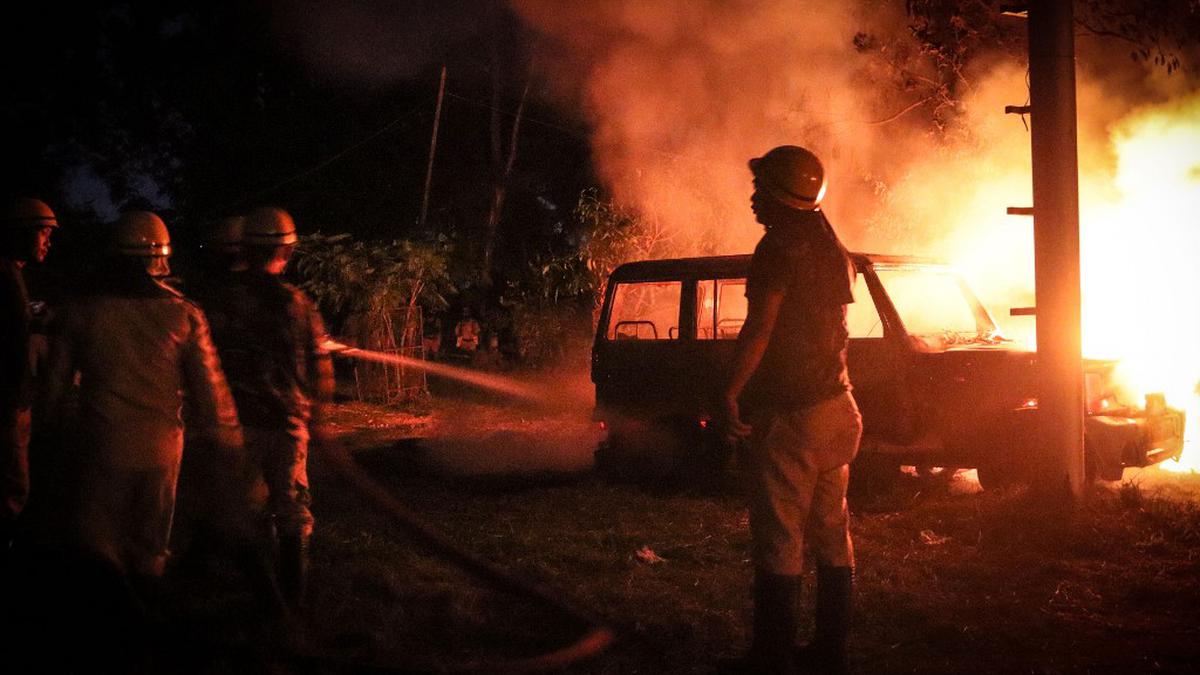
In the 90 days for which data were recorded, only 16 days recorded no incidence of violence. All the other days saw at least one incident ranging from houses being torched, to cars being set ablaze, to bombs being set off, and gunfights between armed groups. These resulted in injuries and deaths of mostly civilians, followed by soldiers, forest officials, and fire service personnel.
Chart 2 | The chart shows the districts where such incidents were recorded. Each circle corresponds to a violent incident. The bigger the circle, the more the number of violent incidents.

Decorated homes, busy temples and shared feasts mark Ugadi in Hyderabad

Housing Minister seeks ₹260 crore to develop 50 slums for Karnataka's golden jubilee, urging CSR support for infrastructure enhancement.

Congress opposes VBSA Bill, citing constitutional overreach, State power encroachment, and politicization of higher education funding.

Hyderabad Airport wins Skytrax 2026 award for Best Airport Staff in India and South Asia for the fifth time.

General and Election Expenditure Observers assumed charge in Krishnagiri to monitor election processes and expenditure across six constituencies.

A detailed analysis of Puducherry’s evolving political landscape and election trends since 2011.

CPI(M) insists on six Tamil Nadu Assembly seats, while DMK offers five, causing a stalemate in alliance talks.

Unaccounted cash, articles worth ₹13.58 lakh seized in Tirunelveli in five days

Ugadi Asthanam at Tirumala temple celebrated with rituals, Vedic recitations, floral decorations, and grand festivities honoring the Telugu new year.

Srirangam temple offers herbal buttermilk and paanakam to devotees to help them stay cool during the summer heat.

VMRDA invites global bids for the Vizag Bay City project to develop a world-class integrated waterfront hub by 2026.

Civil society urges Amit Shah to direct police vigilance against open threats of communal violence in Uttam Nagar, Delhi.

PMK leader Anbumani blames alcohol and drug abuse for rising suicides in Tamil Nadu, criticising government inaction.